The Moment of Truth
Every energy model eventually faces its real test not on held-out data, not in a controlled benchmark, but on a live bill from a utility company. This week, ours arrived.
Our bill-processing server had been tracking meter number 530124 over a 29-day window (Feb 24 – Mar 25). The cumulative read came to 2,124 kWh. Our system had forecast 2,083 kWh. That's a delta of 41 kWh roughly 1.9%.
“A sub-2% error on a real bill, not a test dataset, is a meaningful signal that the approach is working.”
To put that in perspective: a 41 kWh gap on a typical residential bill translates to a few dollars of uncertainty well within the noise of weather variation and occupancy changes. For an energy engineer making retrofit decisions, that level of fidelity is actionable.
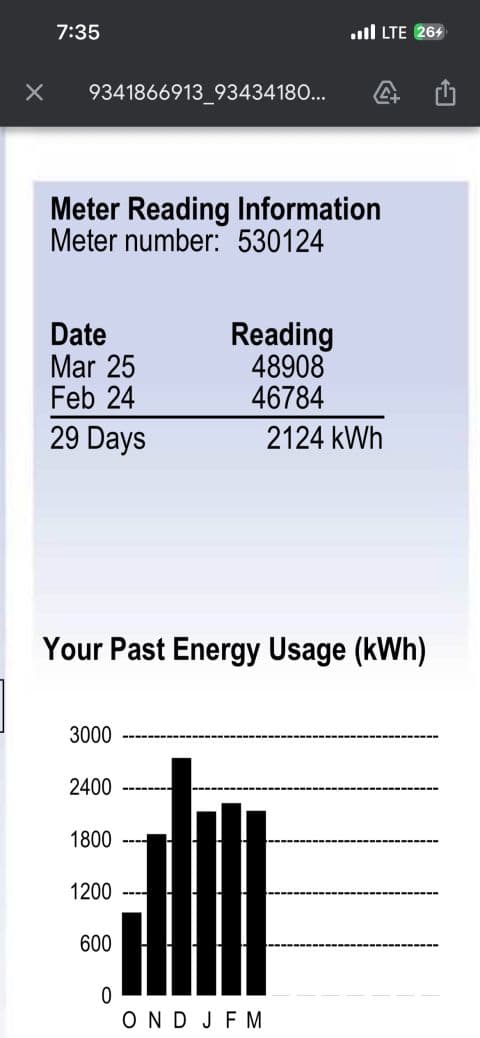
Actual meter reading: 2,124 kWh over 29 days (Feb 24 – Mar 25)
What the Dashboard Shows
The Forecast & Gap view inside Energy Intelligence breaks each billing period into days, overlaying predicted consumption bars against a real-time temperature curve. Here's what we observed for March 2026:
Predicted Usage
2,256 kWh
31-day billing period
Gap Days
26
Bill on the way
Avg Temperature
-1.3 °C
Forecast weather
Solar Potential
3,197 Wh/m²
High irradiance
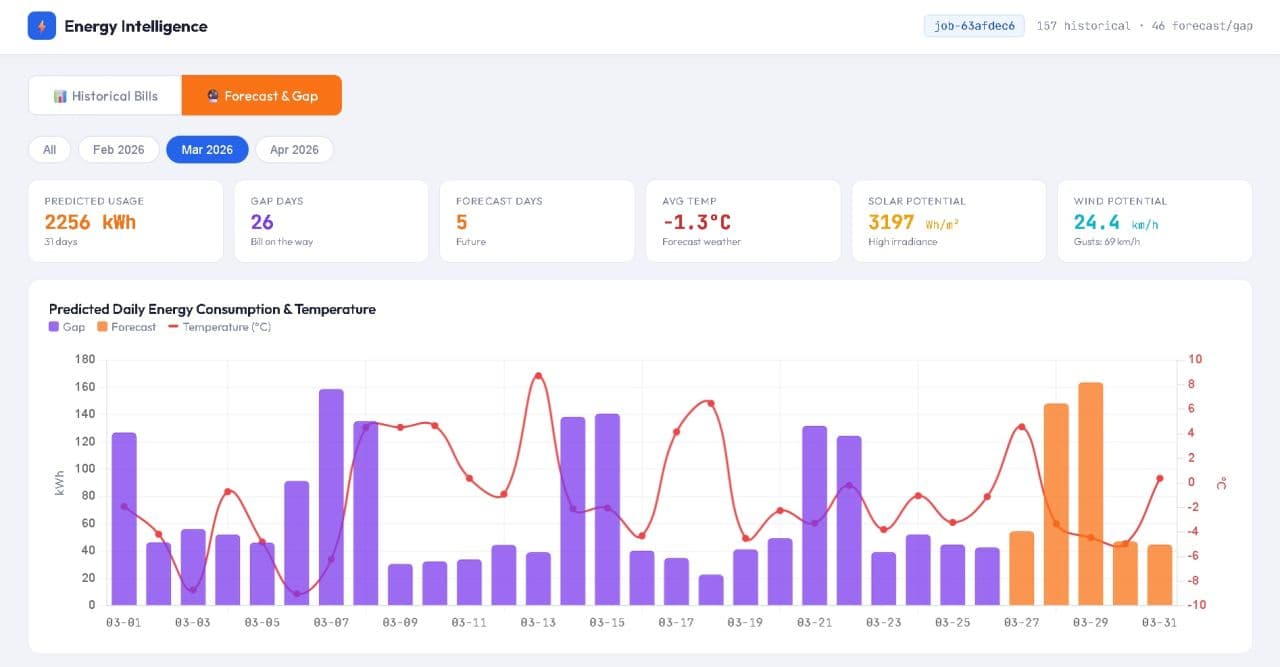
Energy Intelligence Dashboard: March 2026 Forecast & Gap view
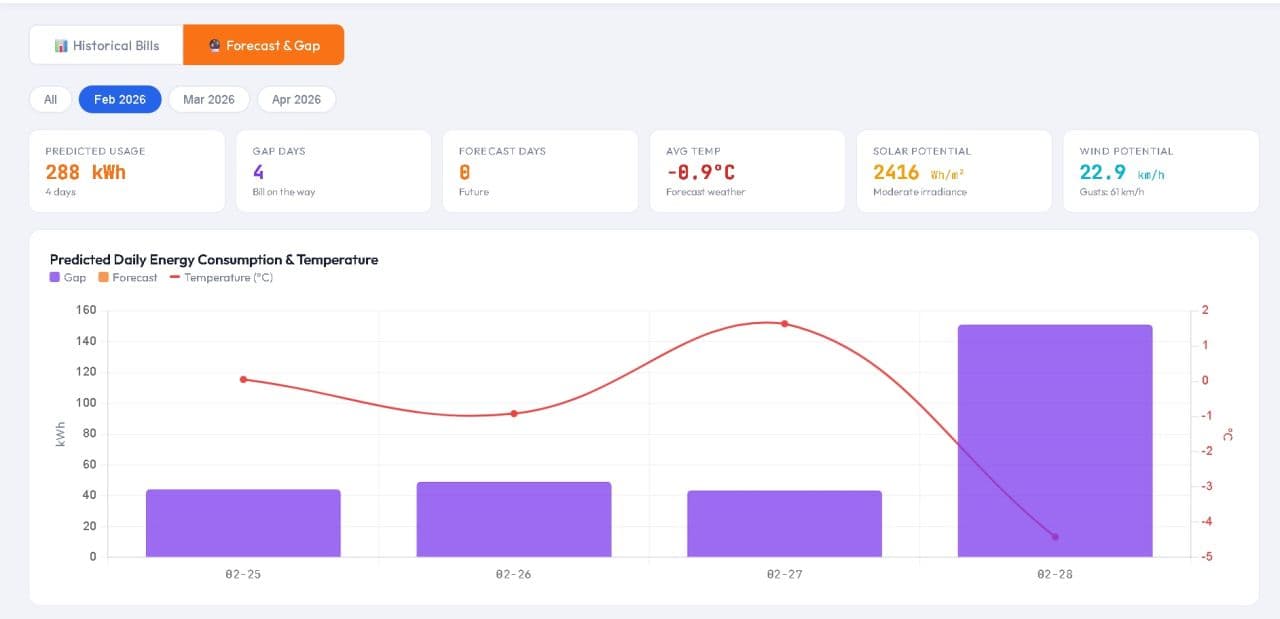
Energy Intelligence Dashboard: February 2026 Forecast & Gap view
The gap between gap days (historical reads) and forecast days (model-driven estimates) is where our confidence interval lives. As more meter data arrives, gap days convert to confirmed reads and the forecast window shrinks giving engineers a live picture of where a building is tracking against its budget.
Why This Matters for Energy Engineers
Energy audits and simulation work have historically relied on static snapshots: an annual ASHRAE-style assessment, a utility data pull, a handful of spot measurements. The problem is that buildings are dynamic occupancy shifts, weather deviates, equipment degrades.
Energy Intelligence is designed to close that loop. Instead of waiting for a bill to tell you what happened last month, you get a rolling, day-by-day forecast with weather-corrected consumption and renewable potential baked in. The goal is to surface anomalies before they become expensive surprises.
What We're Building Toward
Bill Prediction Engine
Sub-2% error confirmed on live meter data. Validated across multiple billing cycles.
Building Energy Profiling
Clear, automated profiles of a building's baseline end-use disaggregation, peak demand windows, and weather normalization.
Building Modelling
Load LiDar scanned a 3D model into our inbuilt light weight CAD tool to model, manipulate, remove, add building components.
HOT2000 Export
Read-made HOT2k export ready file to load into the simulation software and conduct simulation.
Advisor Collaboration Layer
Tools for energy advisors to share dashboards, annotate anomalies, and generate client-ready reports without leaving the platform.
The Bigger Picture
Energy use in buildings accounts for roughly 40% of global carbon emissions. Better data, better forecasts, and faster simulation loops can help engineers and advisors make more impactful decisions faster. A 2% error today might seem like a small win, but compounded across thousands of buildings and retrofit decisions, that accuracy translates into real emissions reductions and real savings for building owners.
We're just getting started. The bill landed. The numbers held. Now we build.
Built for Energy Engineers & Advisors